|
My study aims to determine whether parent-led letter-sound interventions at home paired with regular text/email communications changes student performance on a letter-sound fluency assessment. Participating parents have been given weekly letter-sound awareness activities that correspond to the letter of the week in their children’s classes. I will compare 10 Kindergarten students’ pretest and posttest scores on the same letter-sound fluency assessment. The assessment administration involves measuring the number of letter-sounds a student can name within three seconds during a one minute time period using a series of randomly placed upper and lower case letters. Students were given the assessment before interventions began, and will be given the same assessment again at the end of the program (after five weeks). My research questions are:
Data Source: Pretest and Posttest Scores This data will reveal any changes in performance after treatment is applied. I intend to use descriptive statistics such as measures of central tendency to represent this data. I will use median and mode to describe the collective level of performance on both tests. I decided not to use the mean because I already have an outlier student score that will render the average as a misrepresentation. Although, I have considered using all 3 measures of central tendency: mean, median, and mode--just to be thorough, but it might be overkill! To indicate the diversity of the scores I collect, I will be sure to find the standard deviation. I believe this will be good because, even if I have an outlier, the distance from the mean will be averaged among all the scores so that the influence of the outlier will be slightly absorbed. Finally, I will need to use an inferential statistics method, the Repeated Measures T test, to determine whether the results of the pretest and posttest could be representative of a larger population. I plan to use a bar graph to represent the pretest and posttest scores. I will then use a table to show the median, mode, standard deviation and result of the Repeated T test, “P-value." 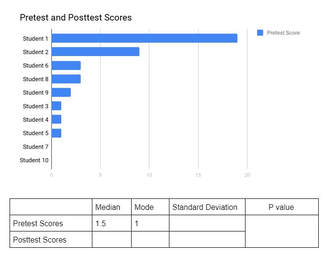 Data Source: Parent Logs and End of Program Questionnaire I will be collecting data about how often and how long parents spend on the activities, as well as ratings (Likert Scale) on parent perceptions of the activities, text/email communications, and the program in general. The first three types of data will help me to answer all of my research questions about relationships between student performance and parent adherence to the program. To determine these relationships, I intend to use Pearsons Correlational Coefficient. This will tell me if there is a positive or negative relationship between student performance and parent ratings. To represent these data, I plan to use graphs because it seems like the simplest way to communicate this information to the reader. There will be three graphs: Relationship between student performance changes and time spent on activities at home, student performance changes and parent rating of text/email communications, and student performance changes and parent rating of literacy activities. 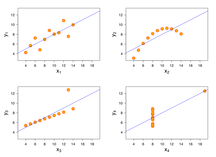 The questionnaire items for parent perceptions about the program will help me to learn about which aspects of the program were perceived as most helpful to the parents. For this, I plan to use a histogram to show each of the program aspects, and the parent ratings for them. 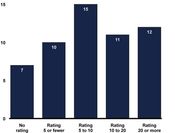 This was the assignment I needed to process the details of the data collection and analysis section of my paper. I had no idea how clueless I was before sitting down to figure out what to do!
2 Comments
Monica Knecht
11/11/2018 05:27:12 pm
Jona, you have done an exceptional job with all of the charts and graphs to display your information. It is very visual and seems easily accessible to the reader. I feel like after reading yours and being very familiar with mine we have a lot of components going on in a lot of directions. I am hoping that I haven't over extended myself in too many directions. I am looking at yours and thinking that for some of my quantitative data graphs and charts may be vary helpful.
Jona Sandau
11/11/2018 09:37:23 pm
Yes, Monica! I feel like the more I get into this, the more complicated it gets. I feel a little nervous about that. I am trying really hard (and spending TONS of time) to keep things coherent and aligned. This is really, really hard. I keep trying to remind myself to go one step at a time. Yikes! Leave a Reply. |
Jona SandauI'm a student in the Innovative Learning Master's Program at Touro University. I'm really excited to make a difference for my students! Archives
March 2019
|
 RSS Feed